

Social Media Content Planning: 30-Day Plan + Examples
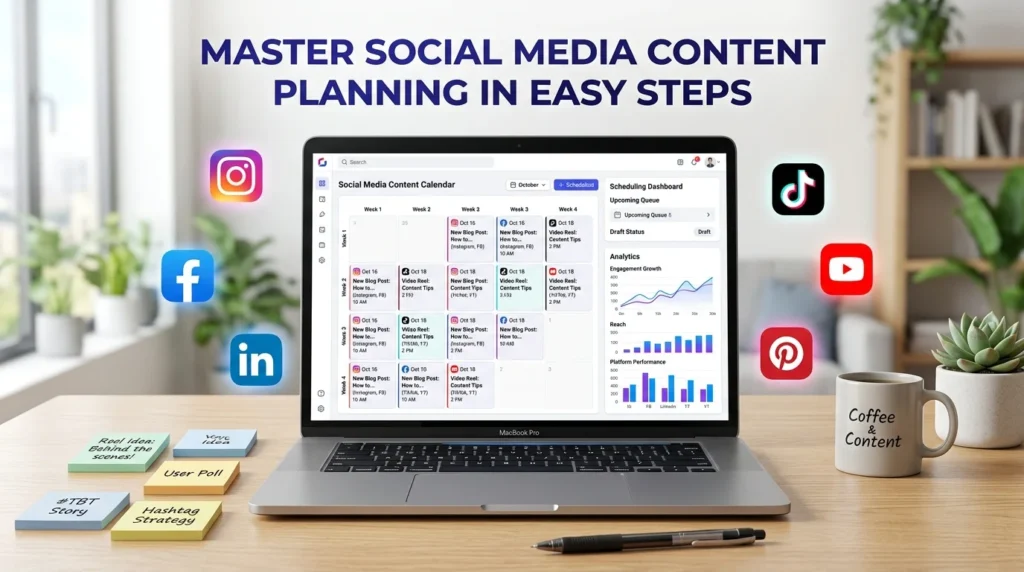
Quick answer: Social media content planning means deciding what to post, where, and when — before the week starts. Pick 4 or 5 content pillars, choose a realistic posting cadence per platform, batch your writing in one sitting, and load it into a calendar. Planning ahead beats posting on instinct because consistency, not volume, is what actually works.
Table of Contents
What Is Social Media Content Planning?
Social media content planning is the process of deciding what you’ll post, on which platforms, and when — done in advance rather than in the moment.
It is bigger than scheduling. Scheduling is loading finished posts into a queue. Planning is everything before that: choosing your themes, deciding your cadence, writing the posts, and making the assets.
A complete content plan answers five questions:
| Question | What it decides |
|---|---|
| What do we talk about? | Your content pillars |
| Where do we post? | Your platform choice |
| How often? | Your cadence |
| In what format? | Video, carousel, image, text |
| Who does what, by when? | Your workflow |
If your plan does not answer all five, the gaps show up as the Sunday-night scramble.
Why Does Content Planning Beat Posting on Instinct?
Three reasons, and only one of them is about time.
Batching is faster than one-at-a-time. Writing ten captions in one sitting takes far less time than writing one caption on ten different days, because you pay the setup cost once.
It protects consistency, which is the thing that actually works. Posting three times every week beats posting twenty times one week and disappearing for two. Planning is what makes a modest cadence survivable.
It frees you up to react. This sounds backwards, but a full calendar means you can drop something in when a trend appears, instead of scrambling to fill an empty week. Reactive posting only feels flexible — it is actually just being late.
Step 1: What Are Your Content Pillars?
Content pillars are the four or five recurring themes everything you post fits into. They are the guardrails. If a post idea does not fit a pillar, either skip it or add a pillar deliberately.
Four or five is the right number. Three gets repetitive fast. Seven means you have no focus.
Here is a real set for a freelance web design studio, which is the running example for the 30-day plan later in this guide:
| Pillar | What goes in it | Share of posts |
|---|---|---|
| Teach | Practical tips people can use without hiring you | 40% |
| Show | Work in progress, before-and-afters, process | 25% |
| Proof | Client results, testimonials, case snippets | 15% |
| Person | Who you are, how you work, opinions | 15% |
| Ask | Offers, availability, calls to action | 5% |
Note the ratio. Only 5% is selling. That is not modesty — it is that the other 95% is what earns the right to the 5%.
On the old 60% curated rule. A lot of guides still recommend a mix of roughly 40% original and 60% curated content — resharing other people’s material. That advice predates the shift to algorithm-driven feeds. Today, platforms distribute content to people who do not follow you based on how it performs, and reshared third-party content rarely performs. Curate a little if it genuinely helps your audience. Do not build your plan on it.
Step 2: How Often Should You Actually Post?
This is where most plans fail, and the data is genuinely surprising.
Posting more does not reliably mean more engagement. Hootsuite’s industry benchmark research found that in many cases a few well-timed posts per week drive higher engagement than posting daily. In one industry breakdown, LinkedIn engagement peaked at 2.95% with just 2 to 3 posts per week — and posting more frequently did not improve it.
The market is moving this way too. Rival IQ’s benchmark report found that for the first time in three years, median posting frequency on Instagram decreased in 2025, which they read as brands choosing quality over volume.
And frequency loses to fit. Quid’s 2026 benchmark data showed brands posting 3.7 times a week on Instagram still being outperformed by TikTok creators posting twice a week. Platform fit and format choice matter more than how often you show up.
What brands actually do, per Rival IQ’s data:
| Platform | Typical brand cadence |
|---|---|
| 3–6 posts per week | |
| 2–6 posts per week | |
| TikTok | 1–3 posts per week |
| 2–5 posts per week |
A starting cadence I would actually recommend for a small team or solo operator: 3 platforms, 3 to 4 posts per week each. That is roughly 40 posts a month, which sounds like a lot until you realise it is nine or ten pieces of writing per week — one batching session.
Start below what you think you can manage. A cadence you can hold for six months beats an ambitious one you abandon in three weeks.
Step 3: Which Platforms Should You Choose?
Being on every platform is the most expensive mistake in social media, and the easiest to avoid.
Engagement varies enormously by platform, and so does whether your audience is there at all. A few things the data supports:
Facebook organic reach is very low. Rival IQ’s figures put organic engagement between roughly 0.02% and 0.23% across most industries. Facebook can still work if you are willing to pay for distribution. Expecting organic results there in 2026 is not realistic.
X is not worth it for most businesses. In Rival IQ’s industry data, some categories post to X once a year, and others essentially never, with engagement rounding to zero. Unless you are in media, sports, or tech, the effort is better spent elsewhere.
TikTok gives new accounts a real chance. Because distribution is algorithm-first rather than follower-first, small accounts can reach people who do not follow them — something Instagram and Facebook largely stopped doing years ago.
Smaller accounts show higher engagement rates. This is consistent across every platform. Accounts under 1,000 followers averaged around 5% on Instagram, while accounts with 10,000 to 50,000 averaged about 3.7%. If your rate drops as you grow, that is normal, not a failure.
Pick two or three. Do them properly. Being excellent on two platforms beats being mediocre on five, and it is roughly half the work.
Step 4: Match Format to Platform
Format choice moves results more than almost anything else you control, and the winning format differs by platform.
| Platform | Strongest format | Supporting data |
|---|---|---|
| Reels for reach, carousels for engagement | Buffer’s analysis of over 2 million posts found Reels best for reach; Hootsuite found carousels at 4.2% engagement | |
| Video and document carousels | Hootsuite put LinkedIn video at 3.9% | |
| TikTok | Short video, optimised for shares | Socialinsider found shares per post up 45% year over year |
| Albums | Hootsuite reported albums at around 2.9% |
One trend worth planning around: engagement is getting quieter. Socialinsider’s analysis of 70 million posts found average comments per post fell on TikTok by 24% and on Instagram by 16%, while video views rose — TikTok up 3% and Instagram up 29%. People are watching more and commenting less.
Practically, that means: plan for views and saves as your primary signals, and stop treating a quiet comment section as failure.
Step 5: How Do You Batch Content Efficiently?
The production workflow is what makes a plan survive contact with a real week.
Do it in this order, in one session:
- Pick your pillars for the month (5 minutes, since they rarely change)
- Draft all your captions first — before any design work
- Then make or brief the visuals
- Then load everything into the scheduler
- Leave 20% of slots empty for reactive posts
Why captions before visuals? Because the caption tells the designer what the post is for. Doing it the other way round means designing something and then reverse-engineering a reason for it. It also lets copy approval and design happen at the same time instead of in sequence.
One session per month, or four shorter ones per week? Weekly batching is easier to sustain and keeps content fresher. Monthly is more efficient but goes stale and hurts more when plans change. Most people do best with monthly pillars and weekly writing.
How to Create an Effective Social Media Content Calendar Template
A social media content calendar is a table where each row is one post and each column is one decision about it. That is the whole concept. The skill is choosing the right columns.
Here are the columns that earn their place:
| Column | What goes in it | Why it matters |
|---|---|---|
| Date | Publish date | The spine of the calendar |
| Time | Publish time | Lets you spread posts across the day |
| Platform | One platform per row | Never one row for “all platforms” — the copy differs |
| Pillar | Which of your 4–5 themes | Lets you spot an unbalanced month at a glance |
| Format | Reel, carousel, image, text, document | Catches “five carousels in a row” |
| Hook | The first line | The only part most people read |
| Caption | Full post copy | The actual deliverable |
| Asset | Link to the image or video | Prevents publish-day scrambling |
| CTA | What you want them to do | Forces you to have one |
| Owner | Who is responsible | Nothing moves without a name |
| Status | Idea / Drafted / Designed / Approved / Scheduled | Where the bottleneck is |
| Link | Post URL after publishing | Needed for reporting later |
| Results | Views, saves, comments | Filled in a week later |
Three rules for the template itself:
One row per post per platform. The same idea posted to LinkedIn and Instagram is two rows, because the copy should not be identical.
Colour-code by pillar, not by platform. Platform is already a column. Colouring by pillar makes imbalance visible instantly — if three weeks are all one colour, you have a problem you can see without reading anything.
Keep the results column. Most people delete it because it feels like admin. It is the only column that tells you what to do differently next month.
Social Media Content Planning Template
Here is a fillable social media content planning template you can copy into a spreadsheet in two minutes.
Sheet 1 — Strategy (fill once, revisit quarterly)
Goal this quarter:        ____________________
Primary audience:         ____________________
Platforms (max 3):        ____________________
Cadence per platform:     ____________________

Pillar 1: __________  Target share: ___%
Pillar 2: __________  Target share: ___%
Pillar 3: __________  Target share: ___%
Pillar 4: __________  Target share: ___%
Pillar 5: __________  Target share: ___%
Sheet 2 — Calendar (one row per post)
Date | Time | Platform | Pillar | Format | Hook | Caption | Asset | CTA | Owner | Status | Link | Results
Sheet 3 — Idea bank (never starts empty)
Idea | Pillar | Best platform | Source (question asked / competitor / trend) | Used? (date)
Sheet 3 is the one people skip and the one that saves them. Every time a customer asks a question, it goes in the idea bank. After a month you never face a blank page again, because the bank fills faster than you can post from it.
The 30-Day Plan: 30 Example Posts
Here is a complete month, written out. The example business is a freelance web design studio, chosen because it is unglamorous enough to prove the method works without a photogenic product.
Setup: 3 platforms, 30 posts across the month — 13 LinkedIn, 13 Instagram, 4 TikTok. That works out to roughly 3 posts a week each on LinkedIn and Instagram, and one on TikTok. Two further slots are left deliberately open for reactive posts.
TikTok is lightest on purpose. It is the most expensive format to produce, and one post a week sits inside the 1–3 range the benchmark data above showed brands actually using.
Pillars: Teach (40%), Show (25%), Proof (15%), Person (15%), Ask (5%).
Adapt the captions to your own business. The structure is the transferable part.
Week 1 — Establish what you know
1. LinkedIn · Teach · Text
Most small business websites fail for one boring reason: the homepage doesn’t say what the business does.
I audited 40 small business sites this year. 23 of them had a homepage headline like “Welcome to our website” or “Excellence in everything we do.”
Your headline should finish this sentence: “We help [who] to [do what].”
That’s it. Nine times out of ten that single change lifts enquiries more than a redesign would.
2. Instagram · Show · Carousel
Slide 1: This homepage took 4 revisions. Here’s every one. Slides 2–5: [each version with one line on what changed] Slide 6: Version 4 doubled their contact form submissions. The only real change? We moved the phone number above the fold.
Caption: Nobody gets it right on the first pass. Anyone who tells you otherwise is showing you the fourth version.
3. TikTok · Teach · Video (25s)
On screen: three website load times side by side. Voiceover: “This site loads in 1.2 seconds. This one in 4. This one in 9. Same content, same host. The difference is image files. Here’s the 30-second fix.”
4. LinkedIn · Person · Text
I turned down a project last week.
Good budget, nice client, work I could do. But they wanted it in nine days and it needed six weeks to be any good.
Taking it would have meant delivering something I’d be embarrassed by, with my name on it.
The hardest part of freelancing isn’t finding work. It’s saying no to work you can’t do well.
5. Instagram · Teach · Reel (20s)
Text overlay: “3 fonts that make a site look cheap — and what to use instead.” Quick cuts, one font per 5 seconds, alternative shown beside each.
6. LinkedIn · Proof · Text
A client came to me with 400 monthly visitors and 2 enquiries.
Six weeks later: same traffic, 11 enquiries.
We didn’t touch their marketing. We changed three things on the site — the headline, the position of the contact form, and removing a popup that appeared after 2 seconds.
More traffic is the expensive answer. Sometimes the cheap answer is sitting on the page you already have.
7. Instagram · Show · Image
Photo of a wireframe sketch on paper beside the finished site.
Caption: Every site I build starts on paper, because paper is cheap and code isn’t. Ten minutes of sketching saves about four hours of rebuilding.
Week 2 — Go deeper on the useful stuff
8. LinkedIn · Teach · Document carousel
“The 9-point pre-launch website checklist” One point per page, plain language, no branding on the pages so people actually save it.
9. Instagram · Teach · Carousel
Slide 1: Your contact form is losing you work. Here’s why. Slides: one form mistake per slide — too many fields, no confirmation message, no reply-to address, requiring a phone number. Final slide: 4 fields max. Name, email, one dropdown, one message box.
10. TikTok · Show · Video (30s)
Screen recording, sped up: building a hero section from blank to finished in 30 seconds. No talking, just captions naming each step.
11. LinkedIn · Teach · Text
“How much does a website cost?” is the wrong question.
The right one is: “What’s it worth if it brings me two more clients a month?”
If a client is worth £2,000 to you and the site brings two extra per month, almost any reasonable build price pays back in weeks.
If you don’t know what a client is worth to you, that’s the number to figure out before you shop for a designer.
12. Instagram · Person · Reel (15s)
Text: “Things I say to every client in week one.” Three quick cuts: “Your competitors’ site isn’t the benchmark.” / “We’re launching before it’s perfect.” / “You will want to change the colours. Wait two weeks.”
13. LinkedIn · Teach · Text
Free tool most people don’t know about: your own site’s search bar.
If people can search your site, the searches are a list of things they wanted and couldn’t find.
I’ve watched businesses spend thousands on market research while ignoring a log of their customers literally typing what they want.
14. Instagram · Show · Carousel
Before and after: five sections of one site redesign, each with a one-line note on what changed and why.
Week 3 — Bring in other voices and proof
15. LinkedIn · Proof · Text
Client quote, then context:
“I stopped apologising for my website.”
That’s the line from a feedback form that I think about most. Not traffic, not conversions — she’d been embarrassed to send people her own link.
That’s a real business cost nobody puts in a spreadsheet.
16. Instagram · Teach · Reel (25s)
“Test your site in 60 seconds, no tools needed.” Three steps on screen: load it on your phone on mobile data, count seconds to first readable text, try to find your own phone number.
17. TikTok · Teach · Video (20s)
“The one accessibility fix that takes 10 minutes and helps everyone.” Demo of adding alt text, then a screen reader reading the page.
18. LinkedIn · Person · Text
Five years ago I charged £300 for a website.
It took me three weeks and I lost money on every one.
What changed wasn’t my skill. It was realising I was selling hours instead of outcomes, and hours have a ceiling.
If you’re pricing by time, you’re capping your own income and you’ll never notice it happening.
19. Instagram · Proof · Carousel
Three client sites, one slide each, with the single metric that moved and how long it took.
20. LinkedIn · Teach · Text
A short list of things clients ask for that I try to talk them out of:
· An image carousel on the homepage. Nobody clicks past slide one. · A popup on arrival. It costs more than it earns. · A live chat widget nobody staffs. · Auto-playing video with sound.
Every one of these was best practice at some point. None of them are now.
21. Instagram · Show · Image
Screenshot of a messy first draft with red annotations all over it. Caption: This is what the middle of the process actually looks like. The polished version you see on portfolios is always the last 5%.
Week 4 — Convert the attention you built
22. LinkedIn · Teach · Document carousel
“What to send your web designer before day one” — the brief template, one section per page.
23. Instagram · Teach · Reel (20s)
“Three signs your site needs rebuilding, not tweaking.” Fast cuts with text overlays.
24. TikTok · Person · Video (30s)
Talking to camera: “The worst feedback I ever got, and why the client was right.”
25. LinkedIn · Proof · Text
Six-month follow-up on a project — what held up, and one thing that did not.
The blog we built has 40 posts now and drives a third of their enquiries.
The booking system we were so proud of? They never used it. They preferred email.
I now ask every client what they’ll actually use, not what sounds impressive.
26. Instagram · Person · Carousel
“A week in the life” — five slides, one per weekday, honest about the admin.
27. LinkedIn · Ask · Text
I have space for two projects starting in October.
Best fit: service businesses with an existing site that gets traffic but not enquiries. That’s the problem I’m fastest at.
Not a fit: ecommerce builds or anything needing a nine-day turnaround.
If that’s you, reply here or email me. Happy to say if I’m not the right person.
28. Instagram · Ask · Image
Simple text graphic: “Two October slots open.” Caption: Who it’s for, who it isn’t, how to get in touch. Same honesty as the LinkedIn version, shorter.
29. LinkedIn · Teach · Text
Wrapping up a month of posting about websites with the shortest version of everything:
Say what you do in your headline. Make the contact form easy. Get it loading in under 3 seconds. Launch before it’s perfect.
That’s about 80% of the value, and none of it needs a designer.
30. Instagram · Show · Reel (15s)
Month-in-review: quick montage of the work shown across the month, ending on the two open slots.
Slots 31 and 32: deliberately empty. For a trend, a client win, or a question worth answering that week.
What to notice about this plan:
The same idea appears in different forms across platforms — post 6 (LinkedIn proof) and post 19 (Instagram proof carousel) cover similar ground in native formats. That is repurposing done properly, not copy-pasting.
Only two posts sell anything, both in week 4, after three weeks of being useful.
Nothing in it requires a studio, a videographer, or a budget. The hardest asset is a screen recording.
Why Do Published Engagement Benchmarks Disagree So Much?
This section exists because I could not write the sections above honestly without it.
While researching this guide, I found the average Instagram engagement rate reported as 4.3%, as 0.98%, and as a range of 0.48% to 0.98% — all in sources published within months of each other. Facebook was reported at 3.6% in one place and 0.15% in another, with a third giving 0.02% to 0.23%. That is more than a twentyfold spread on the same metric.
They disagree because they are not measuring the same thing. Engagement rate can be calculated against followers, against reach, or against impressions. A post seen by 10,000 people from an account with 1,000 followers produces wildly different numbers depending on which denominator you pick. Add different sample sizes, industries, and date ranges, and you get the spread above.
You can watch this happen inside a single source: the same 70-million-post study gets cited as TikTok engagement being 3.70% and up 49% in one place and 2.60% and down 10% in another. Both are real figures from the same research — different denominators.
Three practical rules:
- Never mix sources. Pick one benchmark report and use it for the whole year. Comparing your Q1 to one study and your Q2 to another tells you nothing.
- Check the denominator before you set a goal. If you target 4% based on a per-reach figure but measure per-follower, you will conclude you are failing when you are average.
- Your own last quarter is the only benchmark that fully controls for your audience, industry, and size. Use industry figures for context, not for targets.
I have cited specific figures throughout this guide because vague advice is worthless. But treat all of them as directional.
Top Features to Look for in Social Media Content Planning Software
Ranked by how much they actually matter day to day, not by how they look on a pricing page.
1. A calendar view you can drag things around in. You need to see the month at a glance and move a post without re-creating it. Everything else is secondary to this.
2. Genuine multi-platform publishing. Check your actual platforms, not “12+ platforms.” Some tools handle Instagram Reels or TikTok poorly despite listing them.
3. Per-platform copy variants on one idea. The ability to write one post and adapt the caption per platform, rather than duplicating it. This is the feature that saves the most time and the one most often missing.
4. Draft and approval states. Even solo, you want a difference between “idea,” “drafted,” and “ready.” For teams, a real approval step prevents the wrong thing going live.
5. An asset library. Somewhere images and videos live so you are not hunting through folders on publish day.
6. Analytics you will actually open. Basic per-post performance beats an elaborate dashboard nobody looks at. Check whether you can export, because you will eventually need to.
7. A queue or slot system. Define “Tuesday 9am is a LinkedIn slot” once, then drop content in. Much faster than setting times individually.
8. Bulk upload. Matters enormously if you batch monthly, irrelevant if you plan weekly.
Two things to check before you pay. First, how pricing scales — some tools charge per social account, others per user, others per brand, and a $29 plan becomes $200 fast when you add people or profiles. Second, what the free plan actually limits — usually post volume, number of accounts, or which platforms are included at all.
Best Tools for Social Media Content Planning and Scheduling
A note on pricing before the table. Every figure here was checked in August 2026, and published prices for these tools genuinely conflict between sources — I found Later’s entry price quoted as both $12.50 and $18.75 per month in articles published weeks apart. Check the vendor’s own pricing page before deciding. Treat this as a fit guide, not a price list.
| Tool | Best for | Notes |
|---|---|---|
| Buffer | Solo creators, 2–3 accounts | Free plan covers 3 channels with 10 scheduled posts per channel. Paid from around $6 per channel per month. Simplest option that is genuinely good. |
| Metricool | Analytics-led planning | Free tier covers 1 brand and a limited monthly post count, though LinkedIn and X are excluded on free. Denser interface, strong competitor tracking. |
| Later | Instagram and TikTok-first brands | Best visual grid planner. Entry pricing reported inconsistently; verify directly. |
| Publer | Budget multi-platform | Post recycling and broad platform support at a low entry price. |
| Hootsuite | Enterprise social teams | Deep listening, inbox, and compliance features. No free plan, and pricing starts around $99 per user per month — a three-person team is over $300 before add-ons. |
| Sprout Social | Social as customer support | Premium analytics and inbox. Priced accordingly. |
| Meta Business Suite | Facebook and Instagram only | Free, from Meta. Genuinely fine if those are your only two platforms. |
Recommended tools for social media content scheduling, by situation:
- Just starting, one or two platforms: Meta Business Suite if you are Facebook and Instagram only. Otherwise Buffer’s free plan.
- Solo but serious, three platforms: Buffer or Publer paid.
- You care most about the numbers: Metricool.
- Instagram or TikTok is your whole strategy: Later.
- Agency with multiple clients: Sendible, SocialPilot, or Later’s higher tiers.
- A team where social is someone’s full job: Hootsuite or Sprout Social.
The honest version: the scheduler is a queue. A good queue, sometimes a beautiful one — but a queue still needs someone to fill it. Almost nobody’s results are limited by their scheduling tool. They are limited by not having anything to put in it, which is a content production problem, not a software problem.
Start with a free plan. Upgrade when a specific limitation is costing you time you can name.
What Are the Best Social Media Content Planning Tips?
Twelve tips, ordered by return.
1. Write the hook last. Draft the post, then go back and write the first line. It is easier and the hook comes out sharper.
2. Keep an idea bank. Every customer question is a post. Log them as they happen.
3. Repurpose across formats, not across platforms. One idea becomes a LinkedIn text post, an Instagram carousel, and a TikTok video — each written natively. Cross-posting identical copy performs badly everywhere.
4. Leave 20% of slots empty. A full calendar with no gaps cannot respond to anything.
5. Batch captions separately from visuals. Different modes of thinking. Switching between them is what makes content production feel exhausting.
6. Plan pillars monthly, write weekly. The best balance between efficiency and freshness.
7. Post fewer times on more platforms only if you have the assets. Otherwise it is two mediocre presences instead of one good one.
8. Check your format mix before the month starts. Colour-coding by pillar makes this a five-second check.
9. Fill in the results column. A week after each post. It takes two minutes and it is the only way next month gets better.
10. Reply to comments for the first hour. Early engagement affects distribution on most platforms, and it is the cheapest thing on this list.
11. Kill a platform that is not working. After three consistent months with no results, that is data. Reallocate the effort.
12. Do not chase every trend. Planning exists so you can pick the two trends per month that actually fit your pillars, and ignore the rest guilt-free.
Should You Use AI to Write Social Posts?
Yes, with two boundaries that most guides skip.
AI is genuinely good at the volume work. Thirty captions in a consistent voice, adapting one idea into three platform-native formats, generating hook variants, and cutting a long draft to fit a character limit. That is real time saved on the least creative part of the job.
It is not good at knowing what is true or what is yours. Two specific cautions:
Never publish an unverified statistic. AI models produce confident, plausible, wrong numbers. Every figure in this article is attributed to a named source for exactly that reason. A made-up statistic in a social post is faster to spread and harder to correct than one in a blog.
Disclose where it matters, and know your platform’s rules. Major platforms now label or require disclosure of AI-generated and significantly AI-altered media, particularly photorealistic images and video. Rules differ by platform and keep changing. Text captions are generally treated differently from synthetic images — but check your platforms’ current policies rather than assuming, especially before publishing AI-generated visuals of people.
And the thing worth protecting: the posts in the 30-day plan above that would perform best are the ones with a specific number, a real client detail, or an honest admission. Those are the parts no model can produce for you, because they come from your actual work. Use AI for the 80% that is structure and volume. Keep the 20% that is yours.
7 Mistakes That Break a Content Plan
1. Planning 30 posts per platform. You need roughly 10 ideas, adapted. Not 90 posts.
2. One calendar row for “all platforms.” Guarantees identical copy, which performs badly.
3. Starting with the visuals. The caption defines what the visual needs to do.
4. Choosing a cadence you cannot hold. Three sustainable posts beat seven for two weeks then nothing.
5. Being on five platforms. Almost always two mediocre presences plus three dead ones.
6. No idea bank. Guarantees a blank page every single month.
7. Never filling in results. Means month twelve is planned exactly like month one.
Content Planning Checklist
- [ ] 4–5 content pillars defined with target shares
- [ ] Maximum 3 platforms, chosen on where your audience actually is
- [ ] Cadence set below what you think you can manage
- [ ] Format matched to each platform’s strongest performer
- [ ] Calendar has one row per post per platform
- [ ] Colour-coded by pillar, not platform
- [ ] Selling posts are under 10% of the month
- [ ] 20% of slots left open for reactive content
- [ ] Captions written before visuals
- [ ] Every row has an owner and a status
- [ ] Idea bank has at least 20 entries
- [ ] Every statistic in any post verified against a real source
- [ ] Platform AI-disclosure rules checked before publishing generated visuals
- [ ] Results column filled in from last month
- [ ] One platform review scheduled at 90 days
How Writegenic AI Fits In
Here is the honest division of labour, because it explains where a writing tool helps and where it does not.
A scheduler publishes. A writer produces. Every major tool in the table above — Buffer, Later, Hootsuite, Metricool — is a scheduler. They are very good at queues. None of them solves the actual bottleneck, which is having 30 pieces of writing ready to go in.
Writegenic AI is a writing platform with 300+ templates and support for 120+ languages. For content planning specifically:
- AI Writer and tools library — template-driven drafting for captions, hooks, and platform variants, which is the batching step
- AI Article Wizard — for the long-form pieces your social posts point back to
- AI Prompt Generator — build one reusable prompt that encodes your pillars, voice, and format rules, so every batch comes out consistent. Our guide to what an AI prompt generator is covers how
- AI Image Generator — for supporting visuals, subject to the disclosure note above
- Team features — so a team shares one approved voice instead of five interpretations of it
So the stack is: Writegenic to write it, your scheduler to publish it. Those are different jobs and they do not compete. Pair it with whatever scheduler you already use.
And what stays yours: the specific client number, the honest admission, the opinion you would defend. Those are what made the best posts in the 30-day plan work, and no tool produces them.
Start with Writegenic AI free.
Frequently Asked Questions
What is social media content planning?
Social media content planning is deciding what to post, on which platforms, in what format, and when — in advance rather than in the moment. It covers pillars, cadence, writing, and assets. Scheduling is only the last step of it.
How far ahead should I plan social media content?
Plan pillars and cadence monthly, and write posts weekly. Monthly writing is more efficient but goes stale and hurts more when plans change. Always leave about 20% of your slots empty for reactive content.
How often should I post on social media?
Typical brand cadences run 3–6 posts a week on Instagram, 2–5 on LinkedIn, 1–3 on TikTok, and 2–6 on Facebook. More is not reliably better — Hootsuite’s benchmark data found LinkedIn engagement peaking at 2–3 posts a week, with no improvement above that.
What are content pillars?
Content pillars are the 4 or 5 recurring themes every post fits into. They stop you posting randomly and make an unbalanced month visible at a glance. Four or five is the right number: three gets repetitive, seven means no focus.
What should a social media content calendar template include?
Date, time, platform, pillar, format, hook, caption, asset link, CTA, owner, status, published link, and results. One row per post per platform — never one row covering several platforms, because the copy should differ for each.
What are the top features to look for in social media content planning software?
A drag-and-drop calendar view, genuine support for your specific platforms, per-platform copy variants, draft and approval states, an asset library, exportable analytics, and a slot-based queue. Also check whether pricing scales per user, per account, or per brand — that decides your real cost.
What are the best tools for social media content planning and scheduling?
Buffer for solo creators, Metricool if analytics matter most, Later for Instagram and TikTok-first brands, Publer for budget multi-platform, and Hootsuite or Sprout Social for teams where social is someone’s full-time job. Meta Business Suite is free and fine if you only use Facebook and Instagram.
Is there a free social media scheduling tool?
Yes. Buffer, Metricool, Publer, and Meta Business Suite all have free tiers. They limit post volume, number of accounts, or which platforms are included — Metricool’s free plan excludes LinkedIn and X, for instance. Start free and upgrade only when you can name the limitation costing you time.
Should I post the same content on every platform?
No. Repurpose the same idea into each platform’s native format instead — a LinkedIn text post, an Instagram carousel, a TikTok video. Identical copy cross-posted everywhere performs badly, because each platform rewards a different format.
Why do engagement rate benchmarks vary so much between sources?
Because engagement rate can be calculated against followers, reach, or impressions, and different studies use different denominators, samples, and date ranges. I found Instagram reported at both 4.3% and 0.98% in sources published months apart. Pick one source, check its denominator, and compare mainly against your own past performance.
Can AI write my social media posts?
It can draft them well — captions, hooks, and platform variants at volume. It cannot verify facts or supply the specific client details and honest opinions that make posts work. Never publish an unverified statistic, and check your platforms’ current AI-disclosure rules before posting generated visuals.
Related reading: How to Write GEO-Optimized Articles · Answer Engine Optimization (AEO) · What Is an AI Prompt Generator? · AI Article Wizard
